Google Analytics
- Entity Relationship Diagram
- Table Description
- Data Sources
- Data Destinations
- How to Use Template
- Authorizing Data Sources
- Authorizing Data Destinations
- Most Common Errors
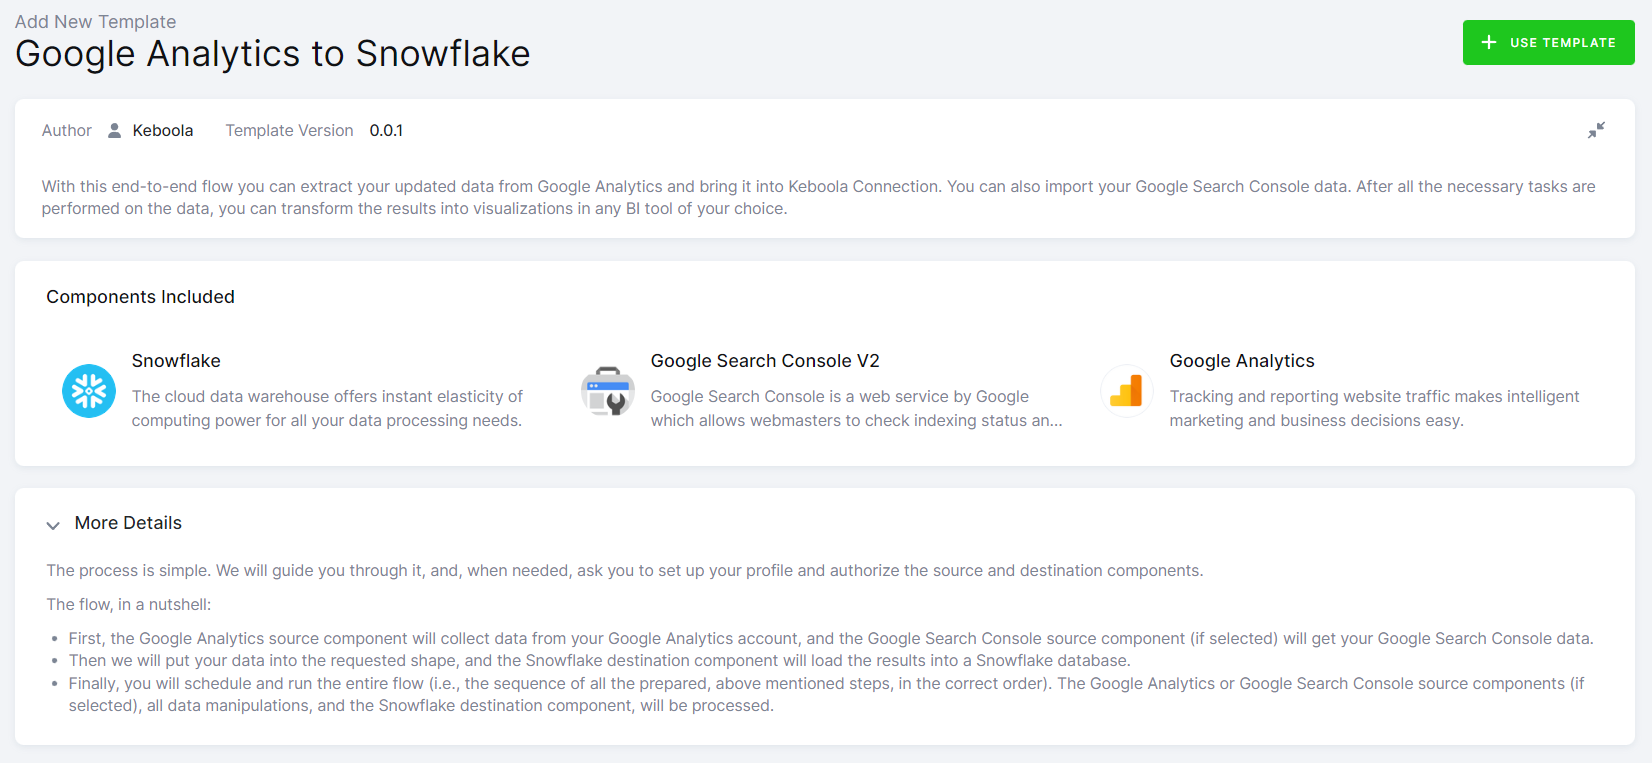
Using one of the Google Analytics templates will provide you with insights into site activities: the length of visits, the number of pages seen per visit, the bounce rate, and many other statistics, which you can see in time or by the traffic source. You can also enrich your Google Analytics data with Google Search Console data. This will show you the average rank of your page in time.
After all the necessary tasks are performed on the data, you can transform the results into visualizations in any BI tool of your choice.
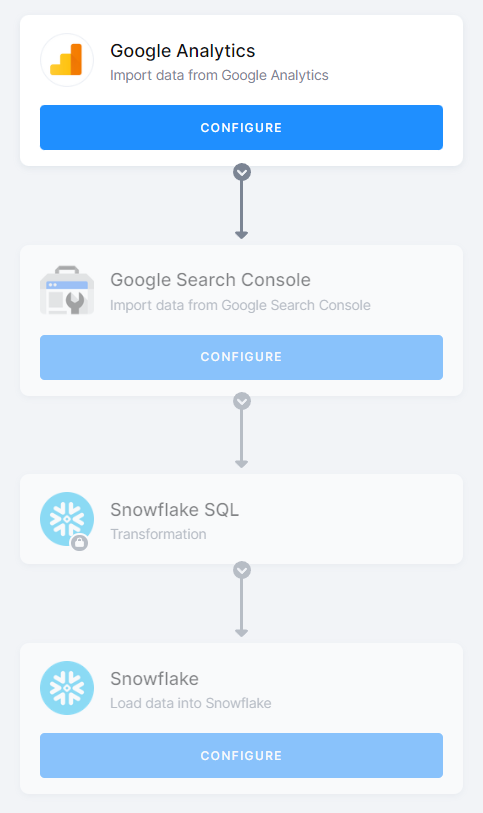
The flow, in a nutshell:
-
First, the Google Analytics data source connector will collect data from your Google Analytics account, and the Google Search Console data source connector (if selected) will get your Google Search Console data.
-
Then we will put your data into the requested shape, and the Snowflake data destination connector will load the results into a Snowflake database.
-
Finally, you will schedule and run the entire flow (i.e., the sequence of all the prepared, above mentioned steps, in the correct order). The Google Analytics or Google Search Console data source connectors (if selected), all data manipulations, and the Snowflake data destination connector, will be processed.
Entity Relationship Diagram
An entity-relationship diagram is a specialized graphic that illustrates the relationships between entities in a data destination.
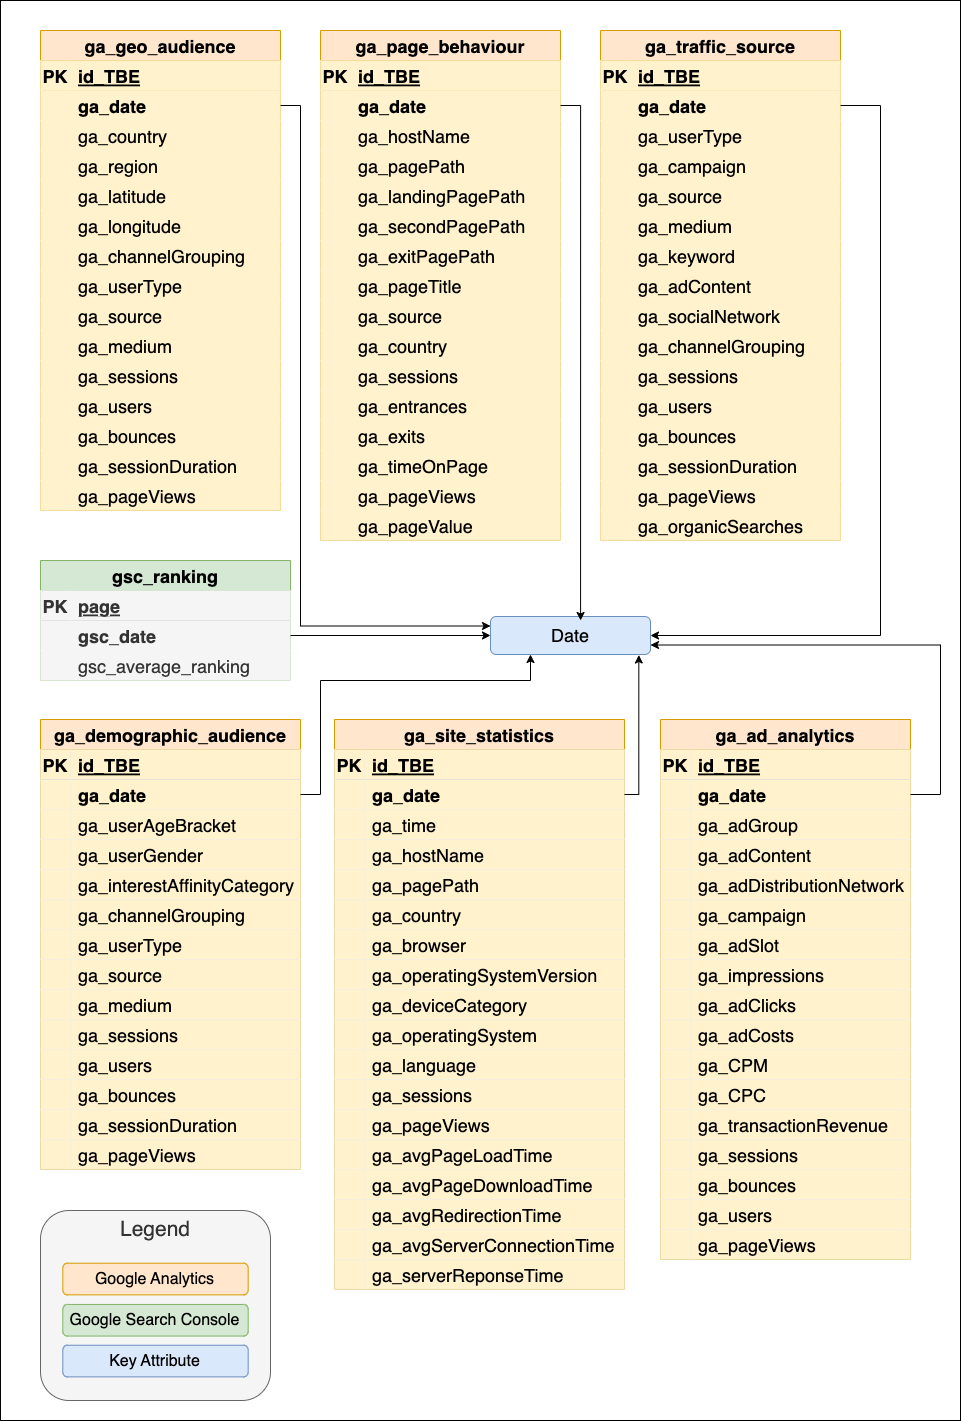
Table Description
| Name | Description |
|---|---|
| GA AD ANALYTICS | contains data about impressions, clicks, costs, sessions, bounces, and pageviews of each campaign per day |
| GA DEMOGRAPHIC AUDIENCE | contains a high-level age/gender focused view of traffic (session) data |
| GA GEO AUDIENCE | contains geographical data that tells you who your visitors coming to website are and where they are coming from |
| GA PAGE BEHAVIOUR | contains data about visitor behaviour on the pages - pageviews, sessions, entrances, and time spent on a page |
| GA SITE STATISTICS | contains data about site statistics: sessions, pageviews, and average time data (page load time, download time, redirection time, and server connection time) per day |
| GA TRAFFIC SOURCE | contains data about traffic sources of each campaign and source per day (sessions, bounces, users, session duration, and pageviews) |
| GSC RANKING | contains data about average ranking of each page per day |
Data Sources
These data sources are available in Public Beta:
Data Destinations
These data destinations are available in Public Beta:
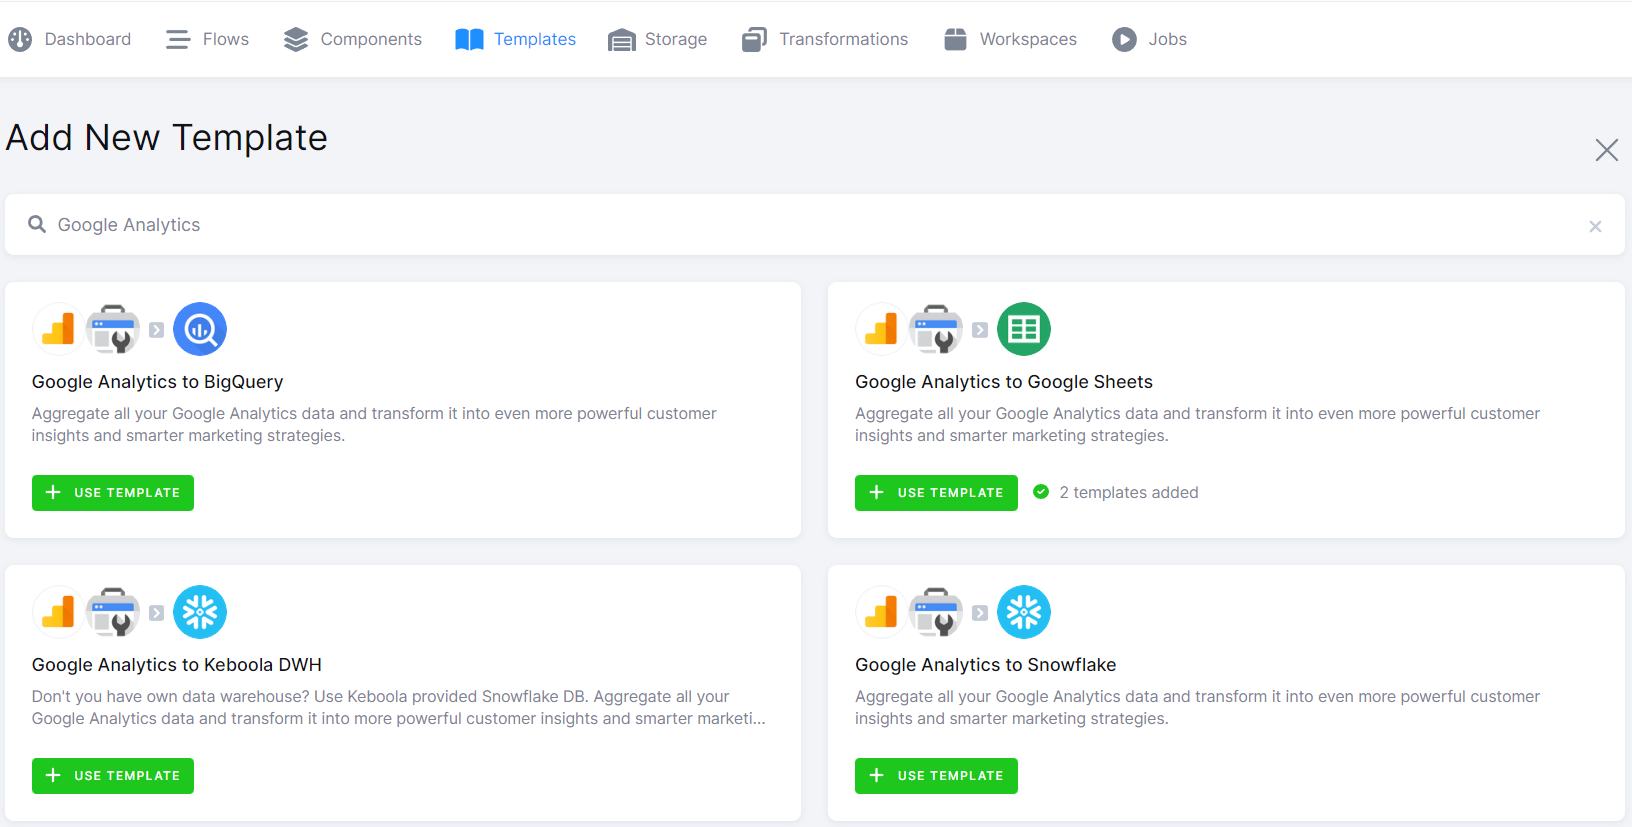
How to Use Template
The process is simple. We will guide you through it, and, when needed, ask you to provide your credentials and authorize the data destination connector.
First decide which data source and which data destination you want to use. Then select the corresponding template from the Templates tab in your Keboola project. When you are done, click + Use Template.
This page contains information about the template. Click + Use Template again.
You’ll be asked to write a name for the template instance you are about to create. You can use the template as many times as you want and still keep everything organized.
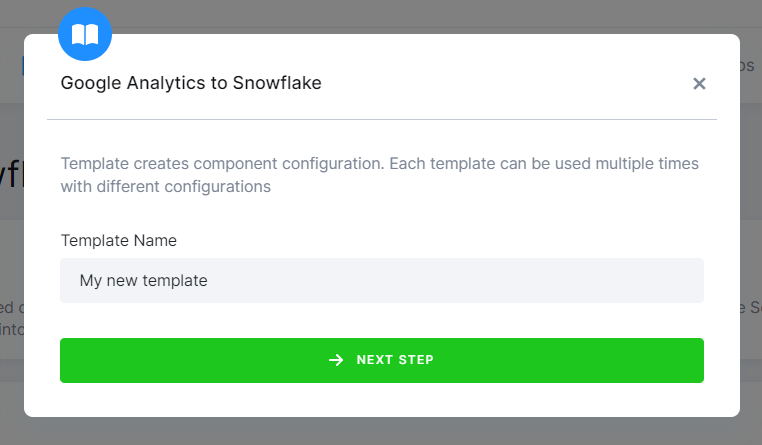
After clicking Next Step, you will see the template builder. Fill in all needed credentials and perform the required OAuth authorizations.
Important: Make sure to follow all the steps very carefully to prevent the newly created flow from failing because of any user authorization problems. If you are struggling with this part, go to the section Authorizing Data Destinations below.
Follow the steps one by one and authorize at least one data source from the list. Finally, the destination must be authorized as well.
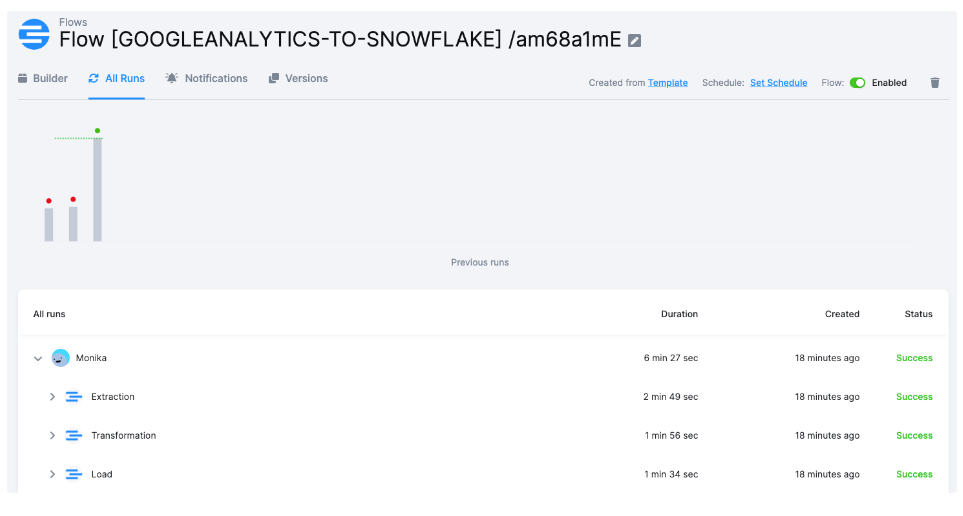
When you are finished, click Save in the top right corner. The template builder will create your new configuration, and when it is done, you will see the newly created flow.
Click Run Template and start building your visualizations a few minutes later.
Authorizing Data Sources
To use a selected data source connector, you must first authorize the data source. In addition to Google Analytics, you can also add data from the Google Search Console.
Google Analytics
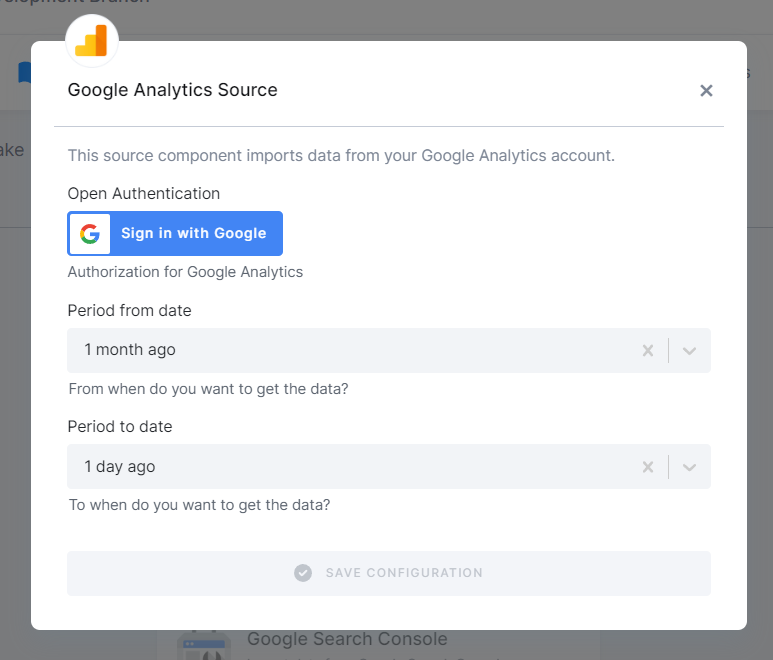
Authorize your Google account and select the period for extracting the data. The list of Google Analytics Profiles will automatically appear after the authorization.
Google Search Console
Using this data source is optional.
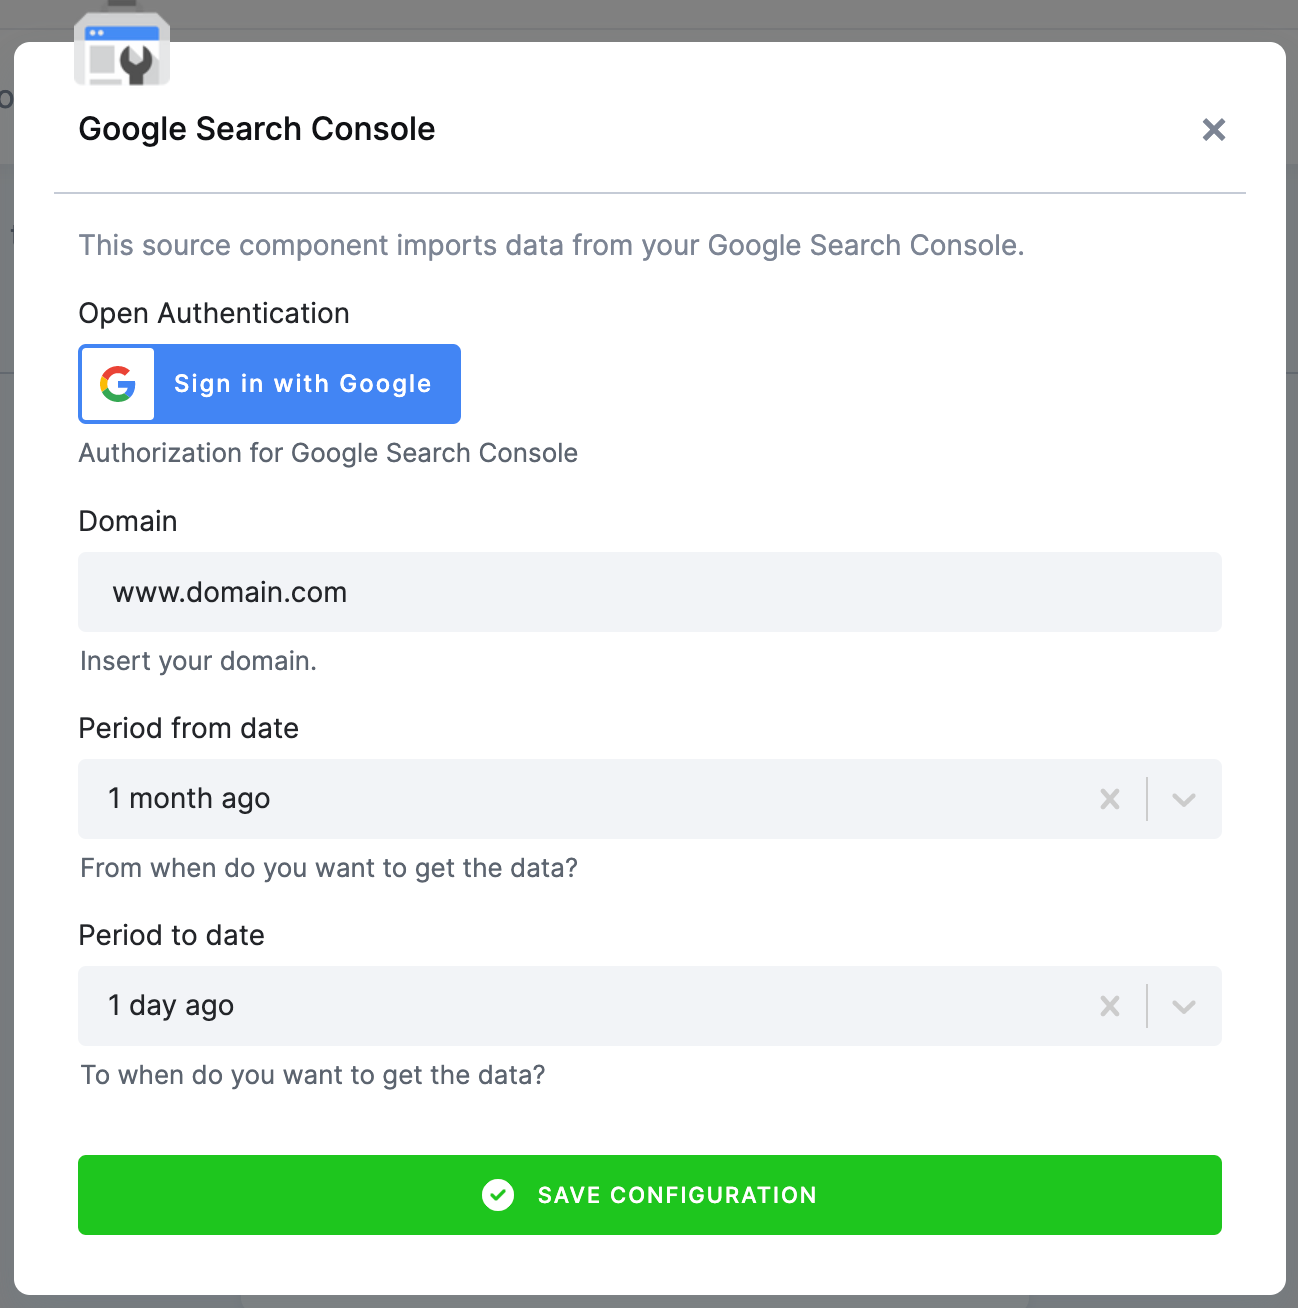
Authorize your Google Account and then fill in your domain.
Authorizing Data Destinations
To create a working flow, you must select at least one data destination.
BigQuery Database
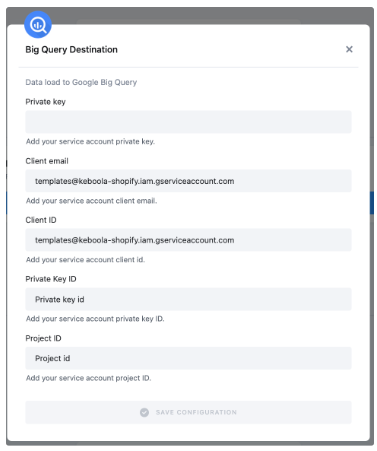
To configure the data destination connector, you need to set up a Google Service Account and create a new JSON key.
A detailed guide is available here.
Google Sheets
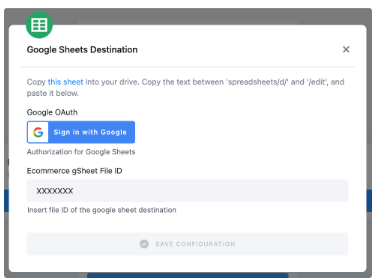
Authorize your Google account.
Duplicate the sheet into your Google Drive and paste the file ID back to Keboola. It is needed for correct mapping in your duplicated Google sheet.
Snowflake Database Provided by Keboola
If you do not have your own data warehouse, follow the instructions and we will create a database for you:
- After clicking Save, the template will be used in your project. You will see a flow.
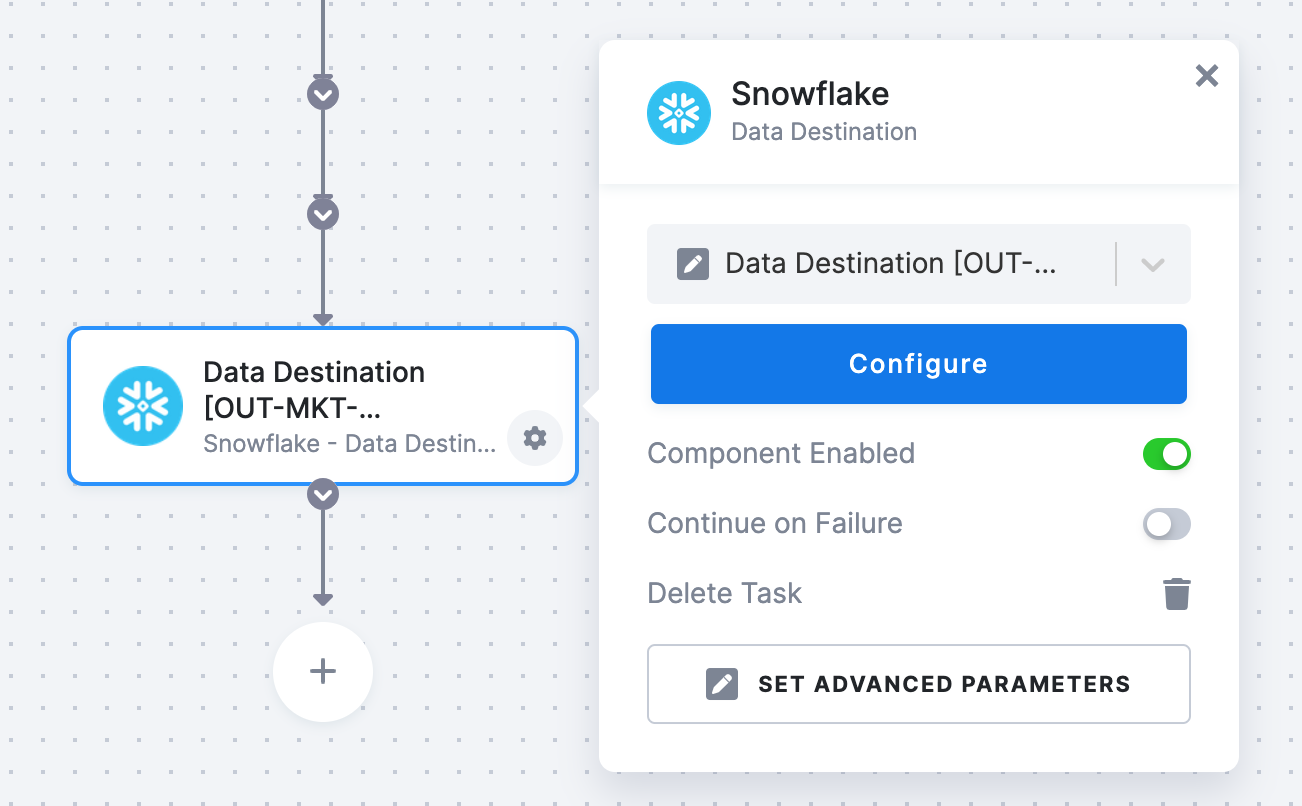
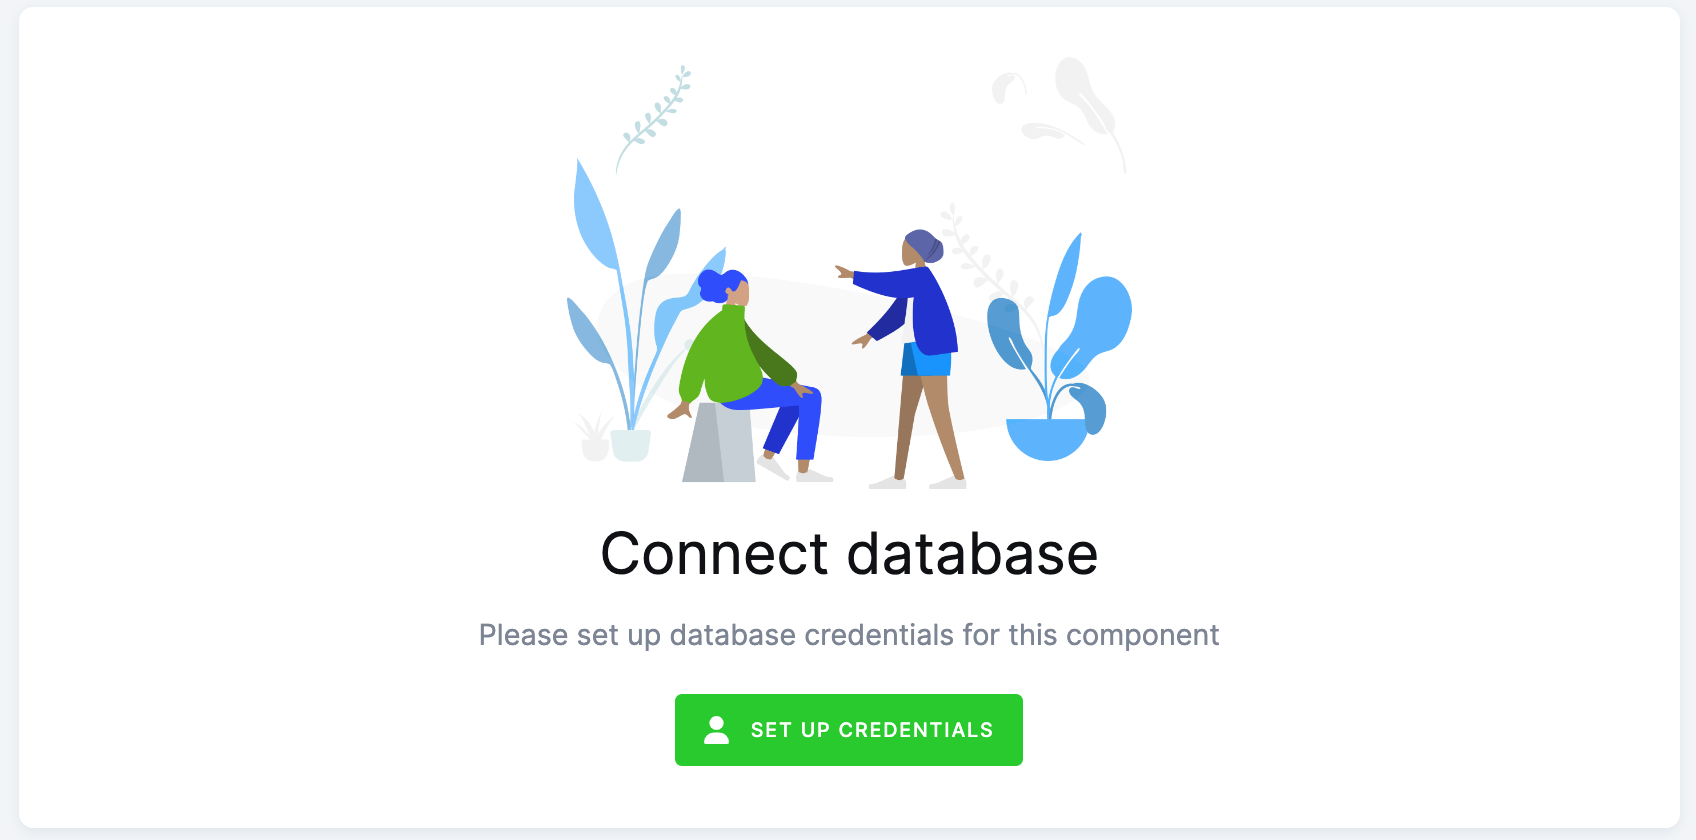
- Go there and click on Snowflake Data Destination to configure it. You will be redirected to the data destination configuration and asked to set up credentials.
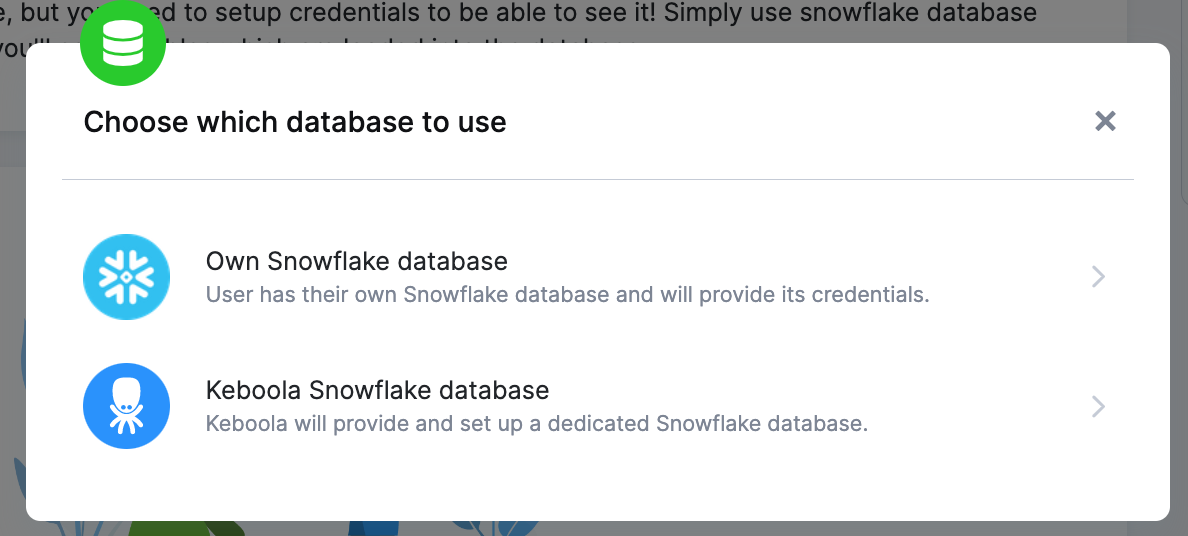
- Select Keboola Snowflake database.
- Then go back to the flow and click Run.
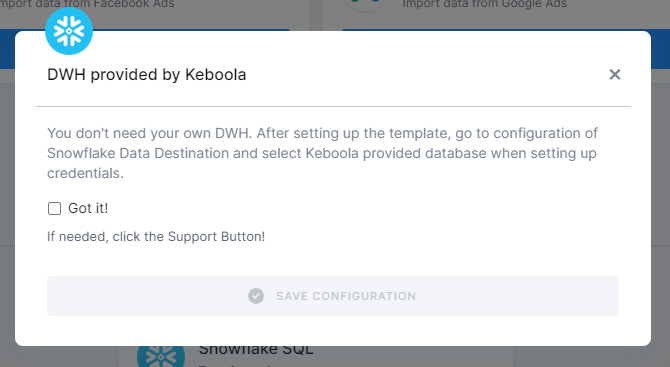
Everything is set up.
Snowflake Database
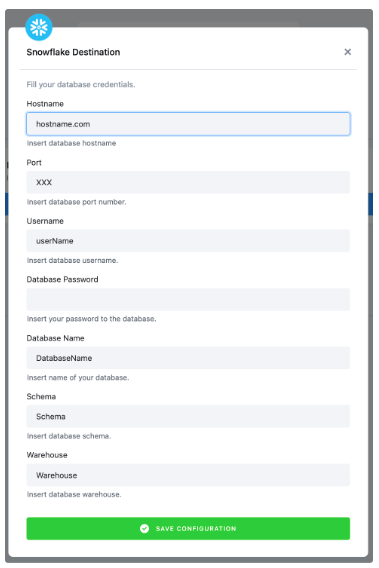
If you want to use your own Snowflake database, you must provide the host name (account name), user name, password, database name, schema, and a warehouse.
We highly recommend that you create a dedicated user for the data destination connector in your Snowflake database. Then you must provide the user with access to the Snowflake Warehouse.
Warning: Keep in mind that Snowflake is case sensitive and if identifiers are not quoted, they are converted to upper case. So if you run, for example, a query CREATE SCHEMA john.doe;, you must enter the schema name as DOE in the data destination connector configuration.
More info here.
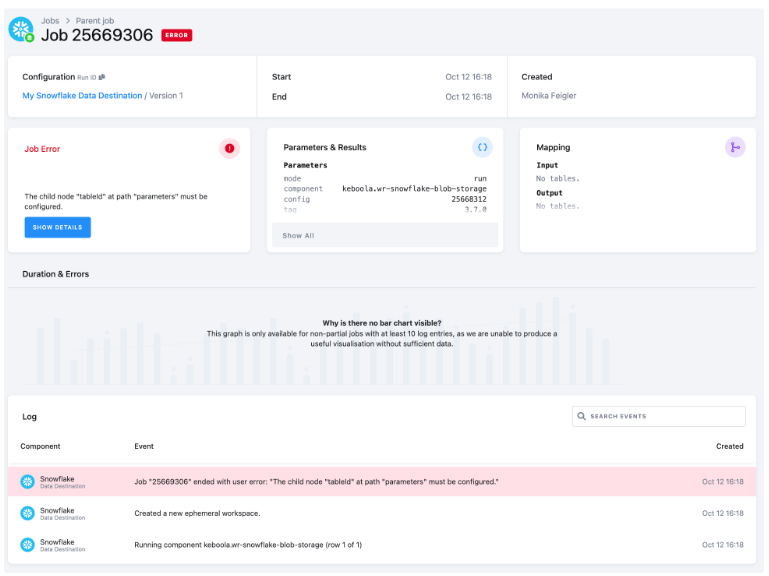
Most Common Errors
Before turning to the Keboola support team for help, make sure your error is not a common problem that can be solved without our help.
Click on the text under Configuration in the top left corner. This will redirect you to the Snowflake Database connector. Now follow the Snowflake Database provided by Keboola on the page Authorizations/destinations.
Then go to the Flows tab and Run the flow again.