Business Data Model Guide
Welcome to the Business Data Model (BDM) Guide!
This guide offers a thorough overview of BDM, helping you apply it to your data management strategies. If you are a newcomer or looking to enhance your existing practices, here is the essential information and actionable tips to maximize the benefits of BDM in your operations.
What Is BDM?
BDM is fundamentally conceptual, distinct from database designs, entity relationship diagrams (ERD), or database performance considerations. It operates on a higher level, focusing on the abstract representation of a business’s data landscape without being tied to specific technologies.
A BDM describes a business in the data language, independent of the underlying technology. It defines and describes “objects,” “properties,” and “values” that are key to the business operation, providing language that simplifies any steps that follow – including decisions about technical implementations and integrations.
Why BDM and What Happens Without It?
Adopting BDM follows the principle of “slow down to speed up.” We have often seen what happens when an eager analyst just “looks at the data,” sees what’s in there, and builds reporting logic on top of it. That’s how data and logic silos are created, and being left to its devices, this approach creates a maze of isolated solutions that becomes incredibly unwieldy as the complexity grows.
One can argue that BDM is nothing new. The terms Logical Data Model or Conceptual Data Model have been used over time, and consulting companies are selling their building services. While the concept is similar, the technique differs, making it available for any business.
By keeping the process simple, we remove the excuse why not to do it. The temptations presented by self-serve BI tools – they just start working with data approach – are showing their shortcomings just a little later. We see multiple definitions of the same objects, disagreements on the meaning of fairly simple concepts and words, business logic baked into code all over the place, and pieces of technology serving single “critical” processes that are nearly impossible to retire later.
Principles of Building a BDM
What You Need
First of all, you need the right people. BDM is way too important to be left just to the techies. Bring an executive responsible for the area you’re describing, and ideally, their boss. Having someone technically inclined from the company helps, mainly for buy-in during later stages. However, their presence is not as essential at the end of the day.
Beyond that, it’s just a whiteboard, Post-its (it’s good to have three different colors), and a few markers. Then, you’re good to go.
While we always digitize the model once it’s at least initially laid out, and it’s possible to do this completely digitally and remotely (Google Drawings are a good start despite its simplicity as multiple people can be working on it at once), we always find it more effective and engaging in person. Often, the first workshop happens on-site, and we follow up with one or two rounds that can be remote, using the digital drawing to collaborate.
Step 0 – Round Up
In complex organizations and processes, the BDM gets complicated. An e-commerce operation that wants to cover everything from marketing to logistics and fulfillment in one go can easily end up with 90+ data objects. Define the area you will cover in the first round and keep it contained.
Let’s say we start with the actual e-commerce part of the mentioned example. That includes the customer, product, order, perhaps invoice, etc., but will not concern itself with campaigns, stores, delivery centers, or inventory. Those would be left for the next round, working off of the e-commerce base.
How do you select the starting point? Either use what is central to the business (the orders are a good example for the e-commerce use cases) or with immediate pain and low-hanging fruit opportunity to deliver value (often marketing and attribution or inventory control & turns).
It’s inevitable that during the following phases, the team will encroach on some of those “no-go” areas. Just call it out, put the Post-it on the side, or mark it visibly as something that no more time is being spent on.
Step 1 – Storm
We will create as many “objects” as possible during this step. Remember that whatever existing systems are in place or planned are irrelevant. Don’t limit yourself to “what we have data about today,” etc. Work diligently to get your audience out of that mindset (sometimes difficult with a technical audience, but necessary).
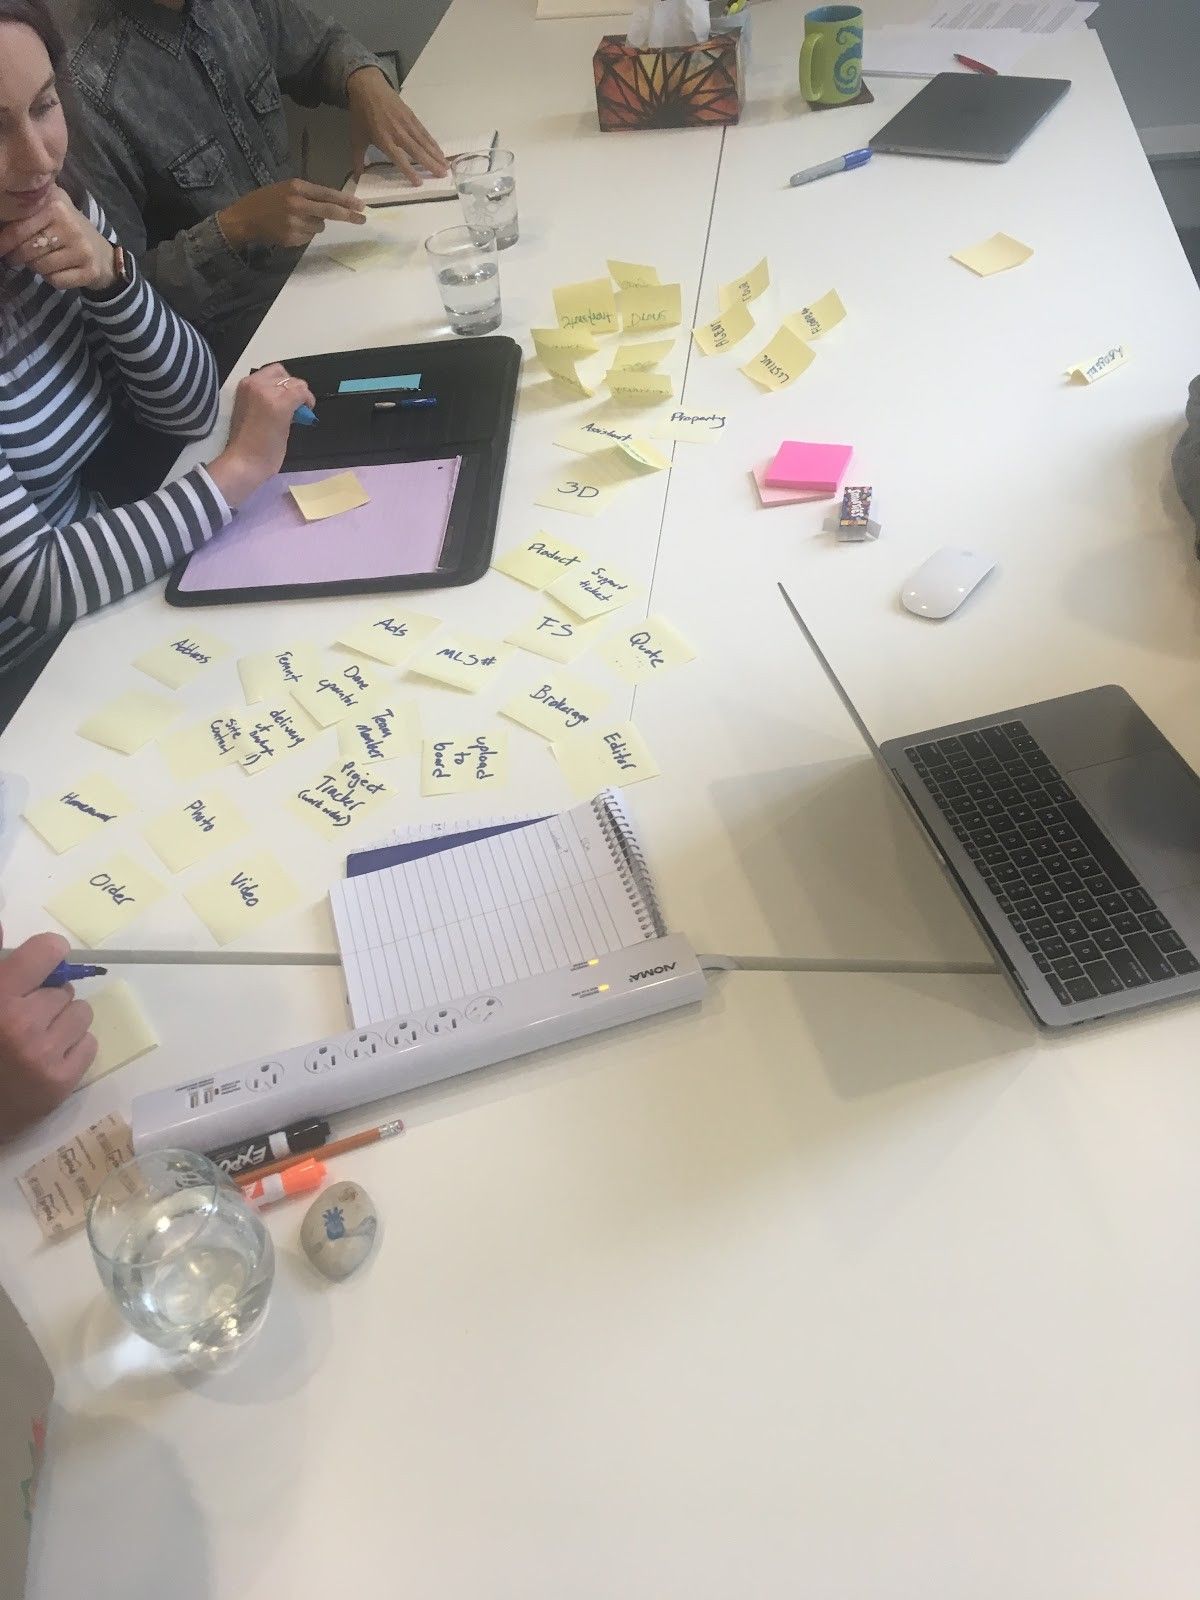
Let’s stick to the e-commerce example. Everyone grabs a marker and a stack of Post-its (use the same color of Post-its for everyone – may we suggest yellow?). Then we’ll start talking about the business. It rolls quite simply. Someone says that there is “Order” and writes it down. Someone else says that “Order has Lines,” on those are “Products” and they belong to “Brands”. Three Post-its are used. Brainstorming rules apply, everything goes, and there’s no editing or arguing, only adding.
Use “Yes, and…” every time. The outcome of this stage is a lot of Post-its; go until no one can think of anything else. While, of course, staying within the boundaries laid out in Step 0. If you’re struggling to get going at this stage, the following sample probing questions can help you:
- What do you sell?
- What “words” pop up in your mind about your business? [Your internal business lingo]
- How do you categorize them?
- Is there a business catalog?
- Who are the key stakeholders?
- What types of customers exist in the business?
Step 2 – Edit & Define
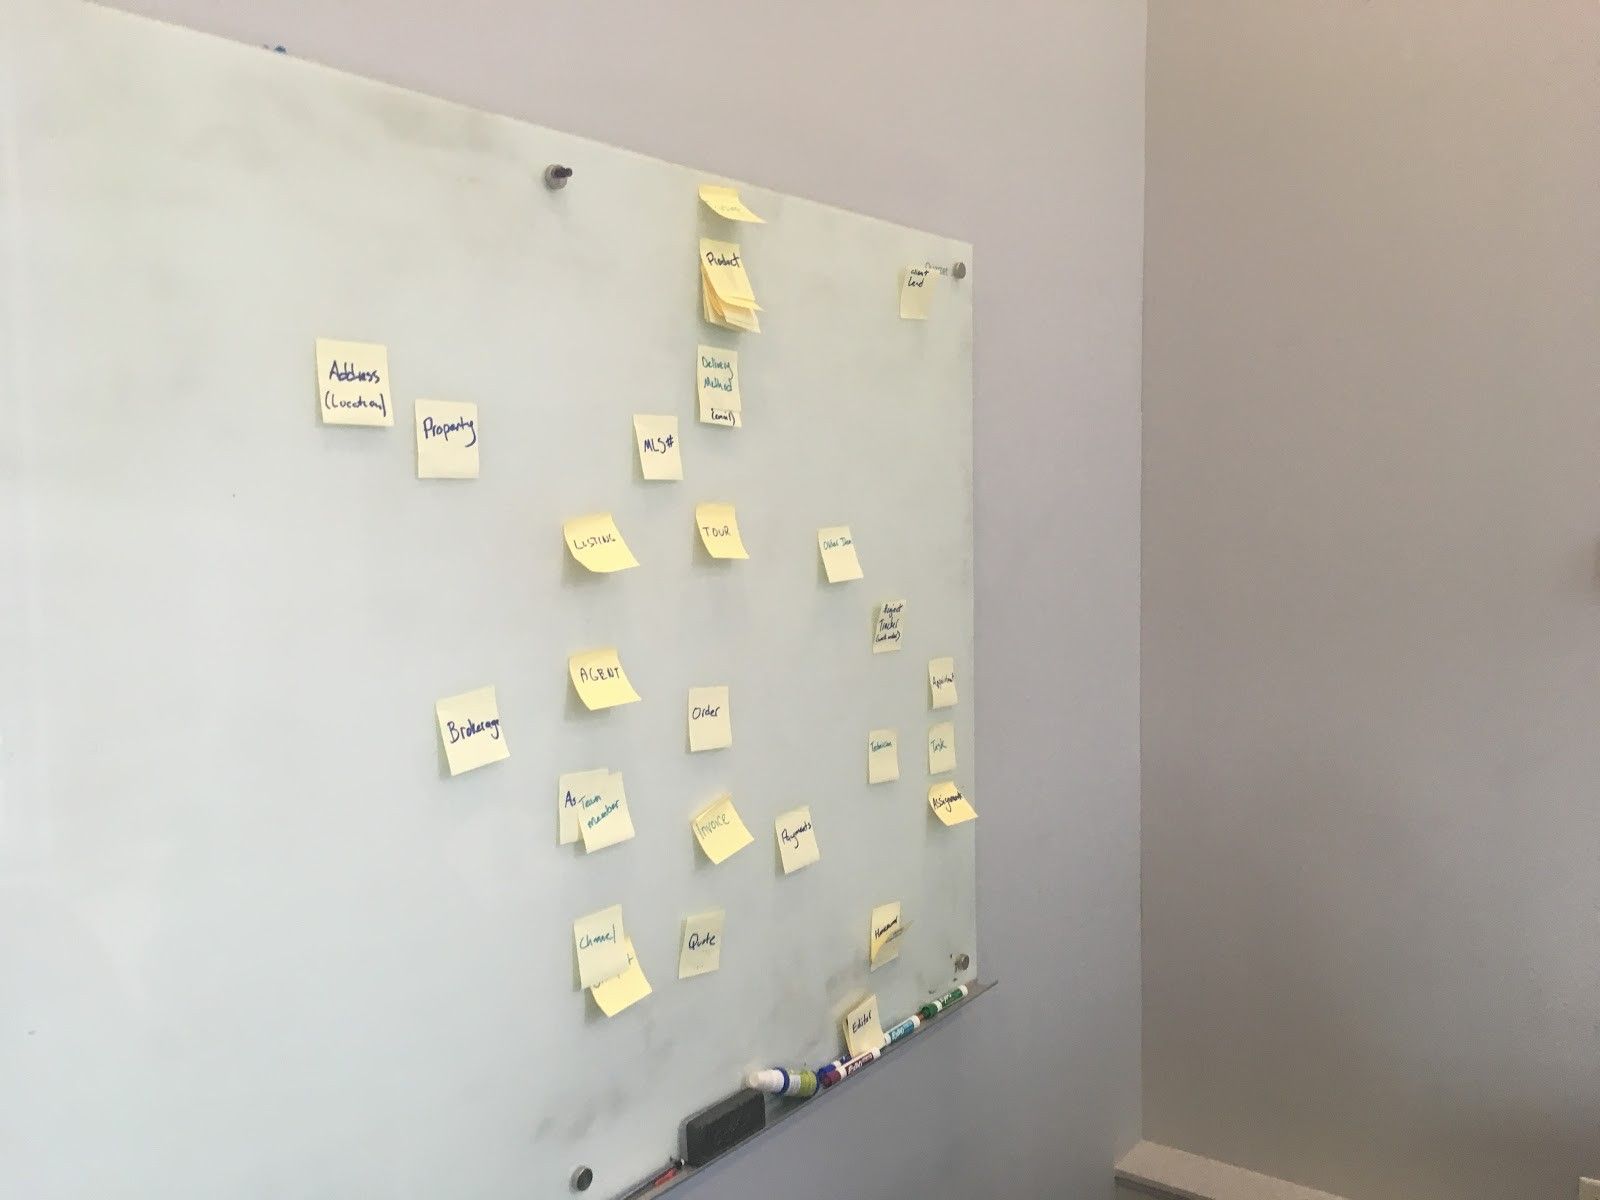
Bring on the whiteboard. Hopefully, it’s clear by this point. Start putting things on. First, the location doesn’t matter, but with practice, you will recognize patterns (and you’ll put “customer-like” objects to the left and “transaction-like” objects to the right, which will save time later. Whenever putting a new Post-it on the board, go through these three steps:
Group
Does this Post-it belong to someone who is already there? (examples - “customer” versus “person” or “account”). Are they really all different things (then keep them separate) or different names for the same thing (then put them on top of each other)?
Classify & demote
Is this an object (going to the left) or a “transaction” (going to the right)? The signs of a transaction are usually a date and time and possibly a numerical value. A transaction is not an object; it’s an interaction between a few (“order” is an object; it exists independently).
“Order receipt” is a transaction, an event, or something that happened to/with the “order” object (we received it). Some objects will lose that status in this step. For example, if you have an “eye color” Post-it because it came out of the Storming stage – is it an object or a property of one? Or “Price,” is that an object or a value?
This is when the two other colors of the Post-its become handy. Use one for “properties” and one for “key values”. When demoting an object to a property or value, just rewrite the name on a Post-it of the appropriate color, discard the original, and place the new one on the board near the object it’s related to – property on the left, value on the right of it.
Rename & clarify
Except for very simple use cases and very small teams, inevitably, there will be different names/Post-its for the same object, and disagreements on what a particular object is. Our favorite example is a “customer” which often suffers from both problems.
We may have Post-its saying “customer,” or “contact,” or “person,” or “subscriber,” or “e-mail.” They may or may not be the same thing. Can a “person” . Still, chances are all this can (and should) be reduced into one or two objects and perhaps a property.
The second issue is a definition. Who is a customer? Someone who is in our system? Someone who placed an order? Someone who paid us? Someone who took a delivery? Often, every department has its understanding of some terms. This is the time to clarify and define.
One of the major benefits of having completed a BDM exercise is that it helps to unify the language within a business and amongst the stakeholders. When we say “customer,” we mean “X.” Time to take notes to start building our dictionary.
Important: It’s imperative to confirm everything with the whole group at this stage. Do not make assumptions based on experiences or points of view. It’s very easy to “steamroll” the participants and insert their own opinions rather than learn what the customer thinks.
At the end of this step, we have clear groups and well-defined objects on the board. The reality is that we often find out during this step (and any of the following ones) that we forgot an object. Can we add it? Absolutely. Go ahead. More is better.
Step 3 – Organize
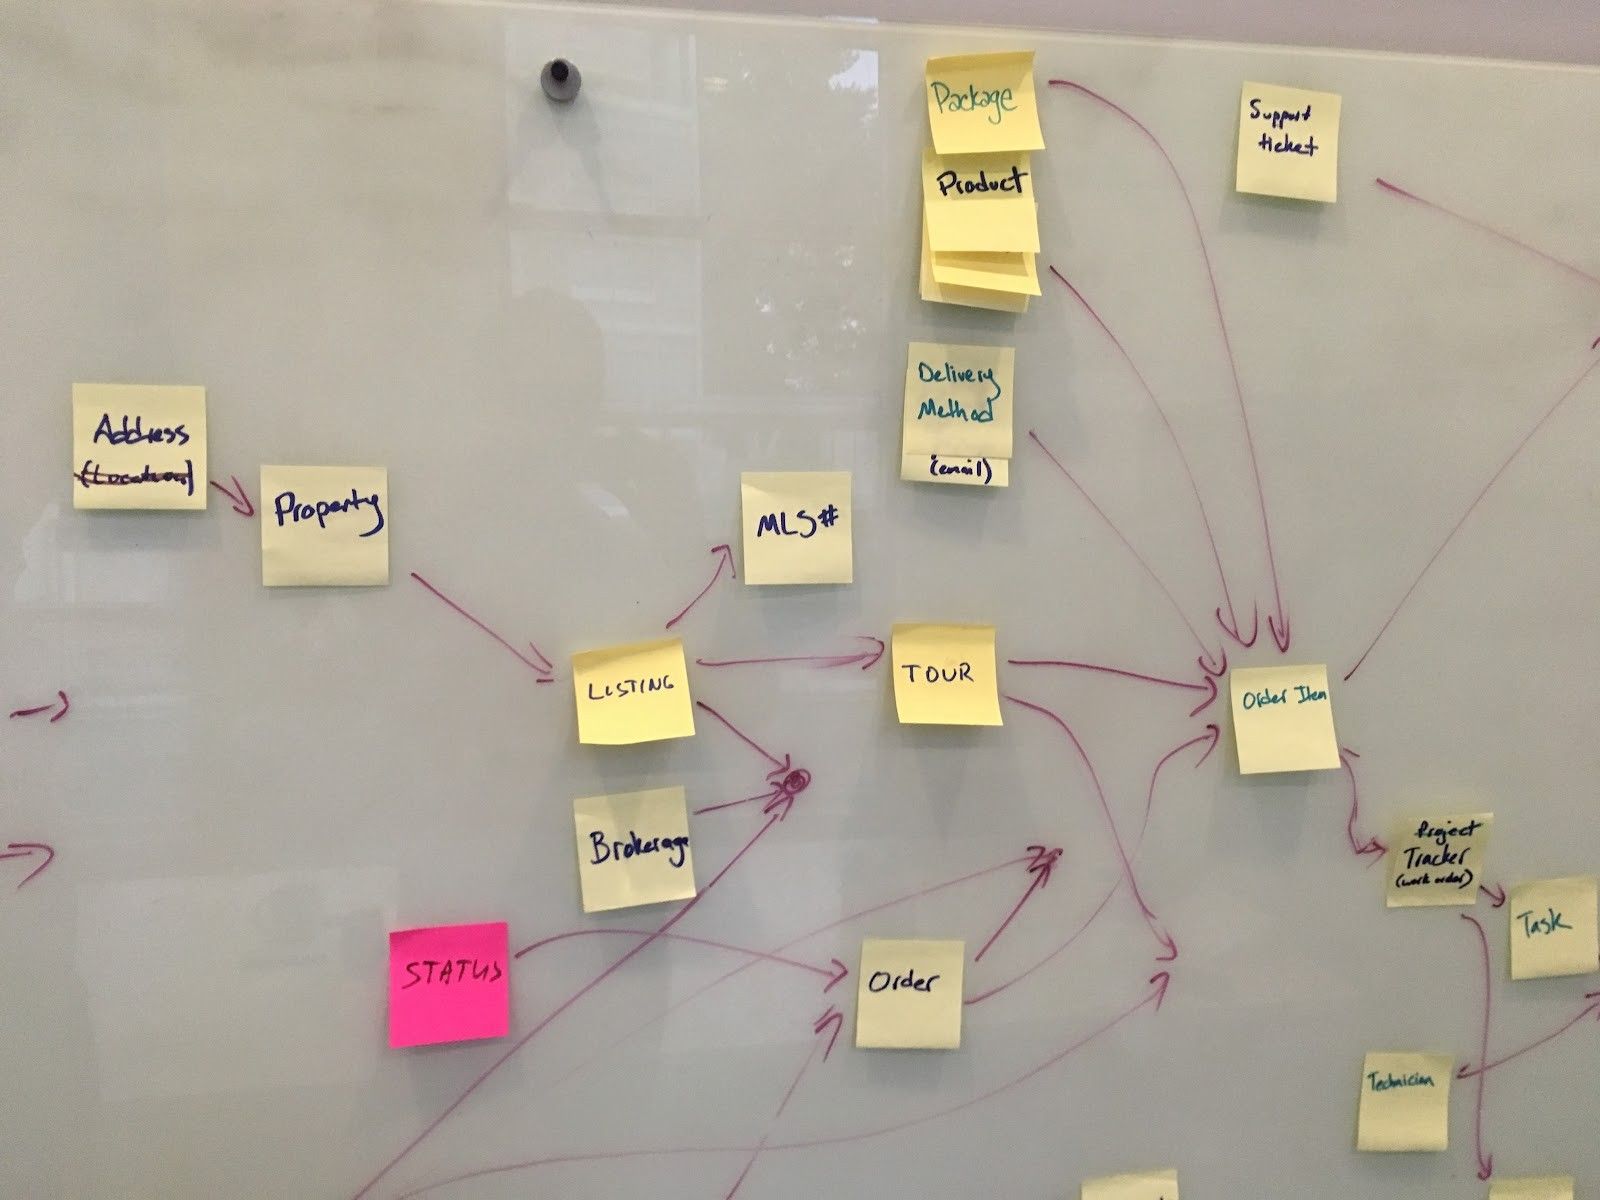
At this point, we have more or less logically arranged groups of Post-its on the whiteboard. The goal of this step is to get from a more or less logically arranged model to an accurate, highly arranged model. This means just moving the groups around a bit and drawing arrows between them. Take a higher-altitude view and ignore the properties and values for a moment. How do the major objects relate to each other?
Parent – child
Most relationships will be parent-child or, in data relations, one-to-many A.K.A. 1:M. Different words for the same thing. A customer has (or can have) multiple orders, but each order belongs just to one customer. Each shipment belongs to a particular order, but one order can be shipped in multiple packages. An order has multiple products on it. But each product… Wait a minute.
Attribution
Do you see what I did there? Order and product have an M: N, or many-to-many, relationship. The same product will (we hope) be on multiple orders. How are the two linked? There needs to be a table that ATTRIBUTES one to another. I’m being obvious here; in this case, it’s the Order Line, which, besides other information (such as amount, price, etc.), represents the link between Order and Product, being a child of both.
However, attribution is not always that easy. Sometimes, we know that objects relate to each other, but there isn’t a transaction or another object handy that would conveniently connect the two. In those cases, we’re free to make one up. Call it “attribution” for now; it may have no other properties besides the facilitation of an M: N relationship between two objects. An example may be a “product” and a “category” or any kind of tagging (many objects can have the same tag / one object can have many tags).
Transitivity
Transitivity ensues when there are multiple paths from a child (or object on the right of the board) to a parent (or object somewhere more to the left of the board). Those are generally undesirable signs of situations where an object represents multiple different entities. Drill in to find out why they’re popping up. The only situation when we (reluctantly) let them pass is when there is NO scenario in hell where these multiple paths could lead to different “parents.” That usually means we have either self-reference or a hidden M: N problem.
Missing links
Sometimes, we get stuck with a relationship that is 1:M, which is all good, but something is missing. That is usually exactly what is happening - we’re missing an object. Either we forgot about it, or it was never defined in the first place; it’s not uncommon for us to name such an object and just see the “aha” moment on the faces of the customers, even though we’re the outsiders and they (think they) know their business inside out. The customer may say: “But we don’t have data for that!” Don’t let that derail you. If it exists, we can infer its existence, and sooner or later, a change will happen to the business providing the data because it makes sense.
Step 4 – Test
Testing the BDM (congratulations, you have version 0.1 on the board by now) is purely language and mental exercise. Throw business questions at it, and answer them using the language on the board while pointing to the objects you are using. What are the sales by product category? That’s a total of Price times Quantity on Order Lines that refer to Products Attributed to that Category. If you’re missing an object, something is wrong. If you’re not following an arrow (against the direction is permissible) at any given point, something is wrong. Question it and drill in.
Step 5 – Iterate
So, we’re reasonably happy with it. The question is: what is missing? Depending on the complexity, time of day, quality of coffee served, etc., you may get an enthusiastic response or an exhausted “looks good to me” answer. If the former, go at it; if the latter, let people sleep on it and reconvene roughly a week later.
Examples & Templates
Using Templates
What follows is a section of templates or patterns that tend to repeat themselves. After all, there are only so many ways to describe invoice or recurring revenue business. Avoid the temptation of just using them as they are without going through the process. What makes a business unique is how they think about their business, and forcing standards or templates means we’re reducing them to a clone, denying them (and ourselves) the chance of discovering something exciting. Use those sparingly, as an inspiration, as a secret weapon that helps speed up the process here and there.
Knowing the examples doesn’t make you an expert. The ability to create your own during a conversation with the customers does. The process and the customer’s involvement in it have a value of their own, even if you end up with a 1:1 image of a template. It’s not about creating the BDM; it’s about making the customer understand and buy into it.
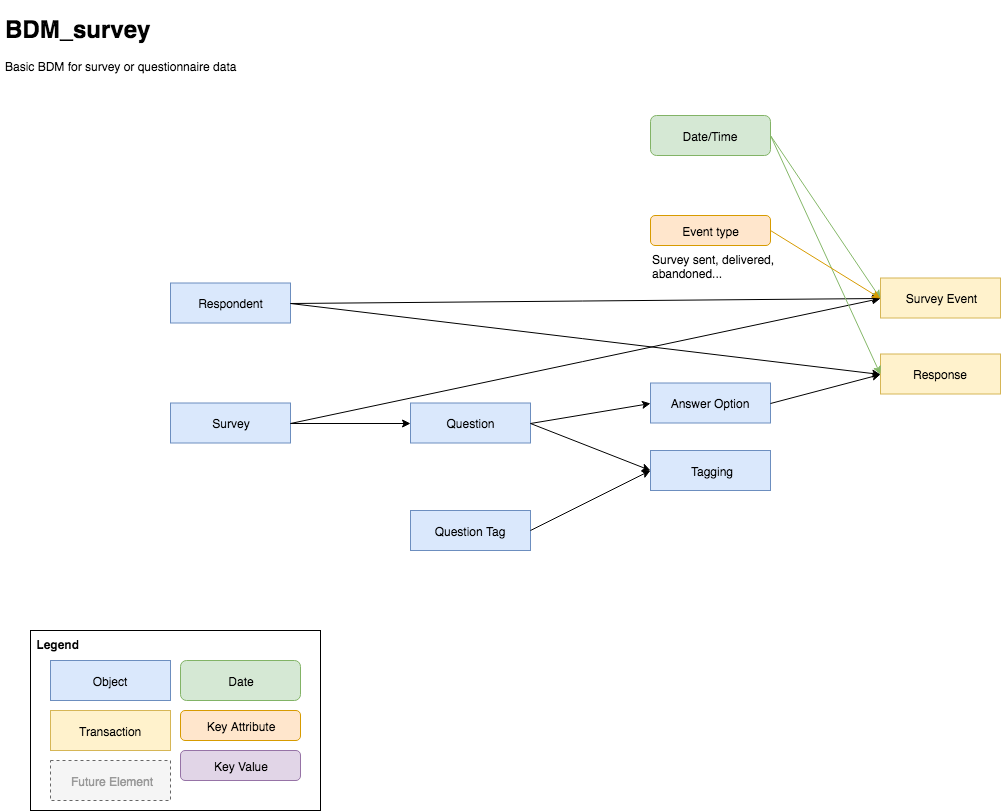
Survey Data
Most survey systems and their API suffer from the age of Excel. The data coming out is not very useful in structure and requires heavy transformation, even though the BDM is rather simple. It’s questions and answers. As such, it creates a great example of the usefulness of BDM. We would design ourselves in the corner very quickly, trying to work with the data as is.
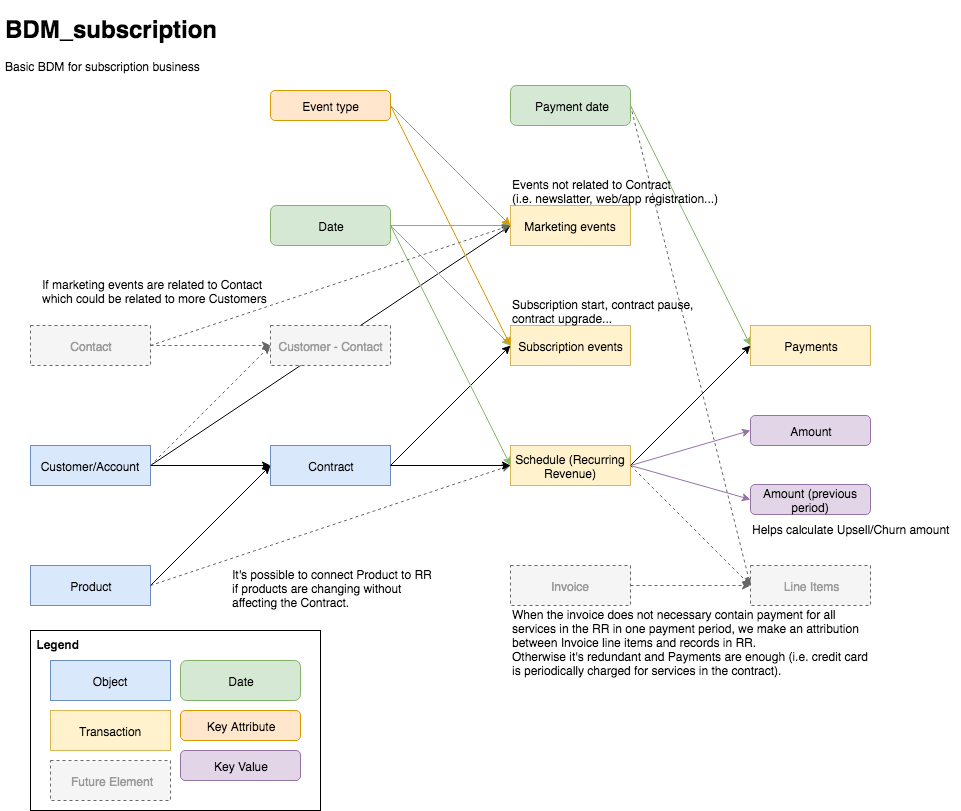
Subscription (Recurring Revenue) Business
Regardless of the service or widget, there is a benefit in looking at most businesses through the lens of “recurring revenue.” This basic template works in most subscription contexts (think Software as a Service, magazine subscription, gym membership, and everything in between).
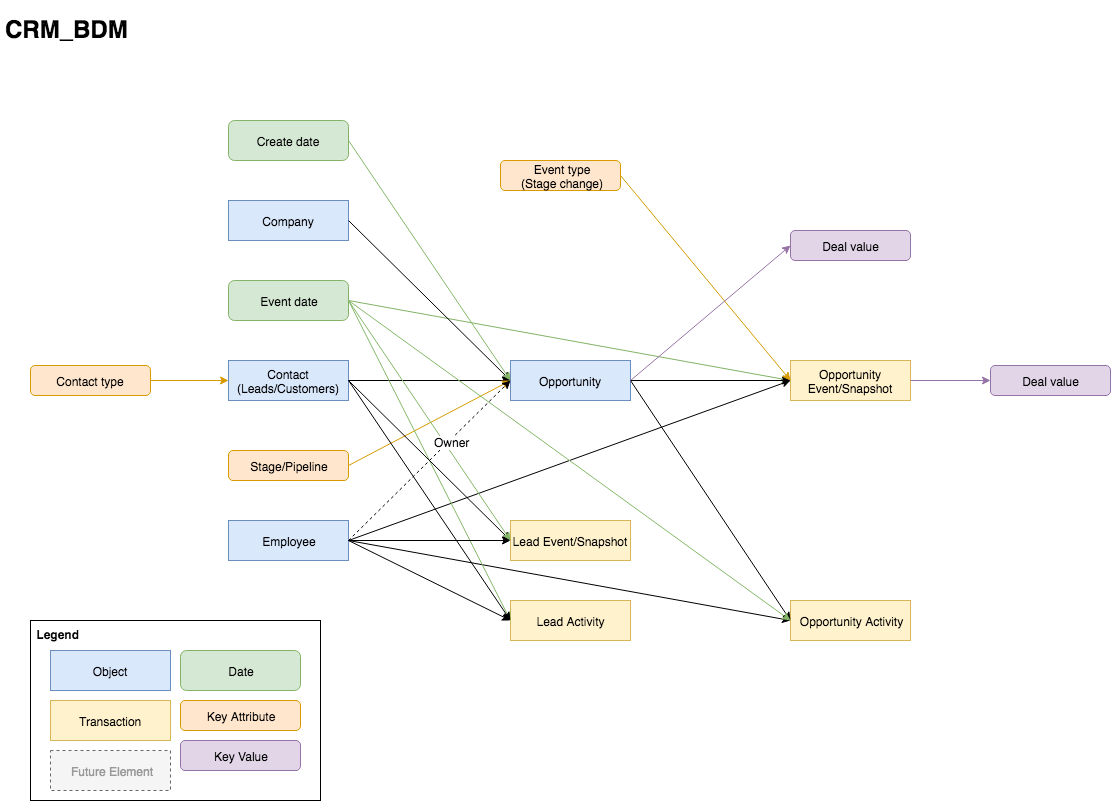
Customer Relationship Management
That title looked better than “CRM,” but that’s what it means. Various CRM systems are notorious for how they take simple concepts and make the data very complicated. Again, that means a trap and future headache if you try to take the data as-is without a bit of thought given to it beforehand (looking at you, Tableau SFDC connector!).
e-Commerce – Marketing Side
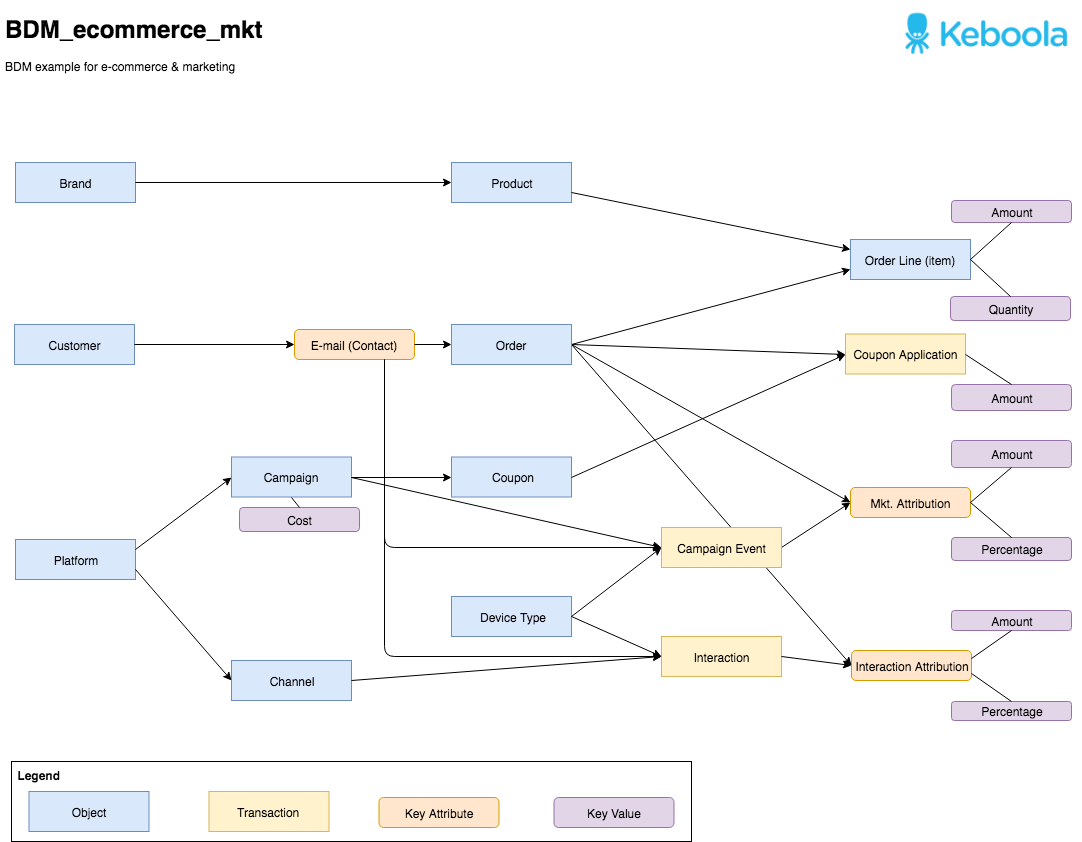
An e-commerce operation is a data-heavy affair. As mentioned above, we can carve out the orders, the marketing, or the logistics side. Each of them is a project of its own. This one is looking at the marketing side.
