Sklik
The Sklik data source connector fetches data from Sklik. It downloads configured reports for all specified accounts.
Before you start, have a working Sklik account, and get an Sklik API key. Select Settings from the drop-down menu next to your account name in the top right corner of the screen. The API key is on the bottom of the Account Settings page. Copy it to your clipboard.
Configuration
Create a new configuration of the Sklik connector.
Then provide your API key:
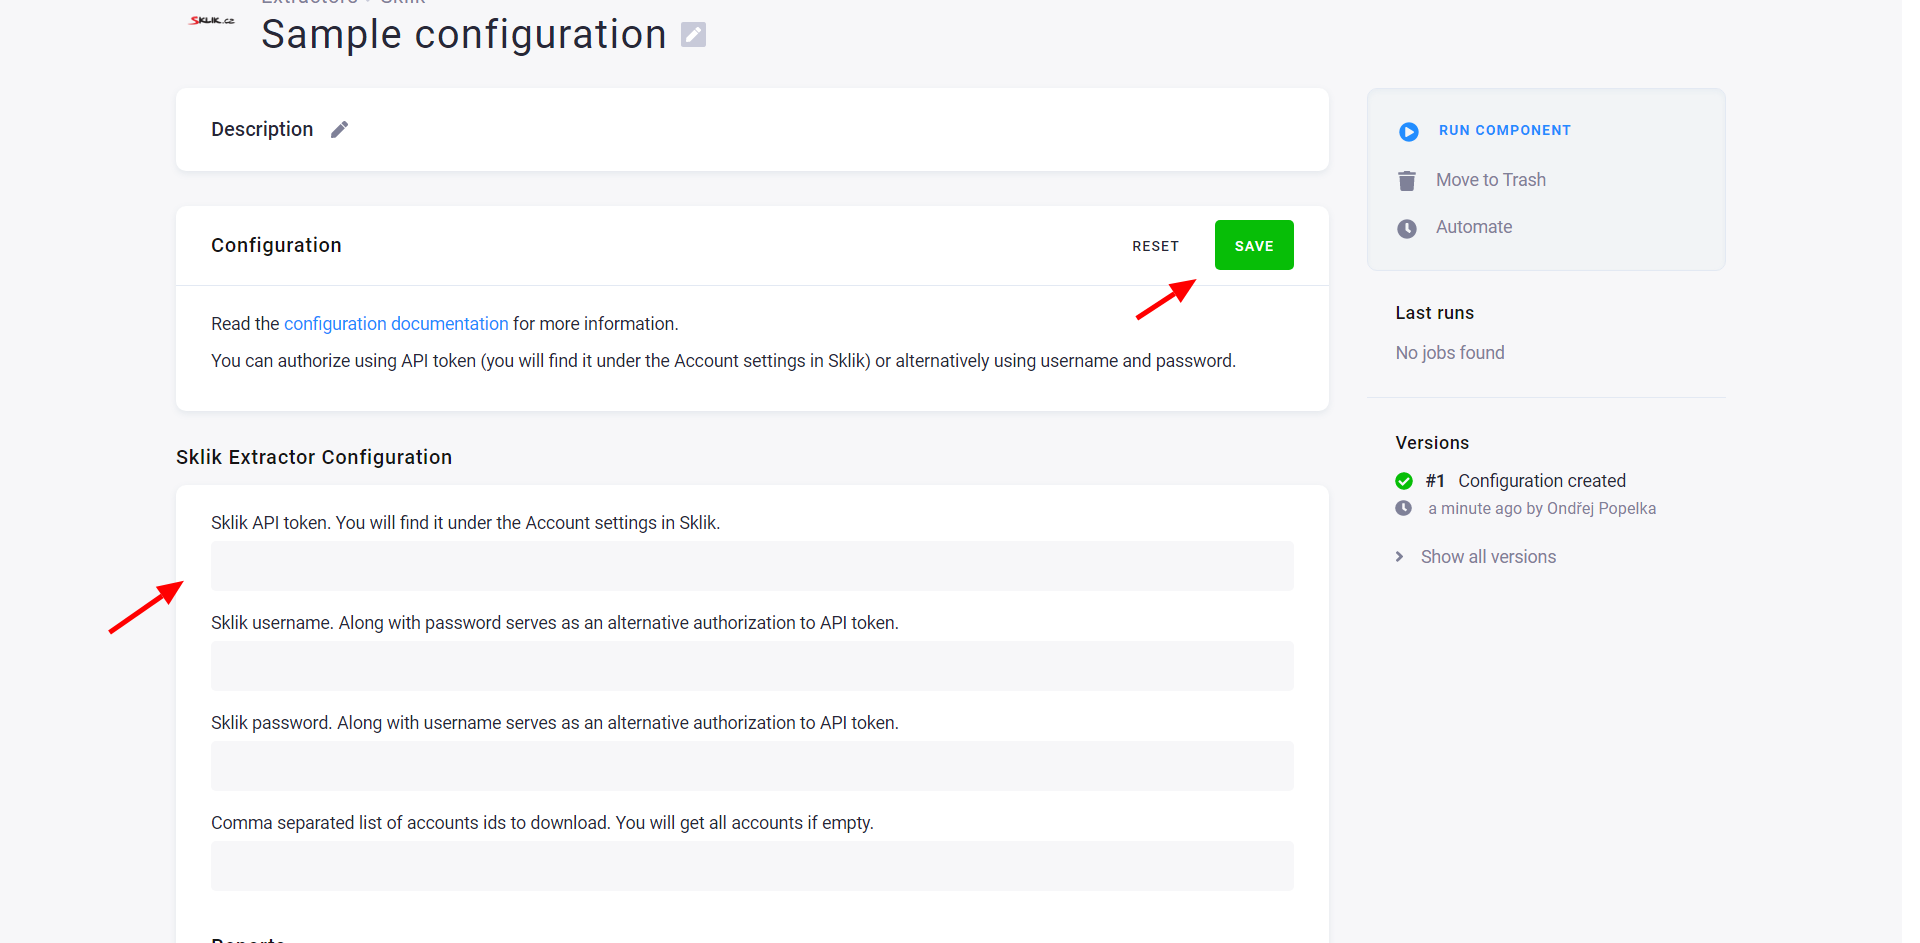
The data source connector gets a list of all accessible accounts unless you restrict them explicitly.
Configure Reports
Now configure your reports:
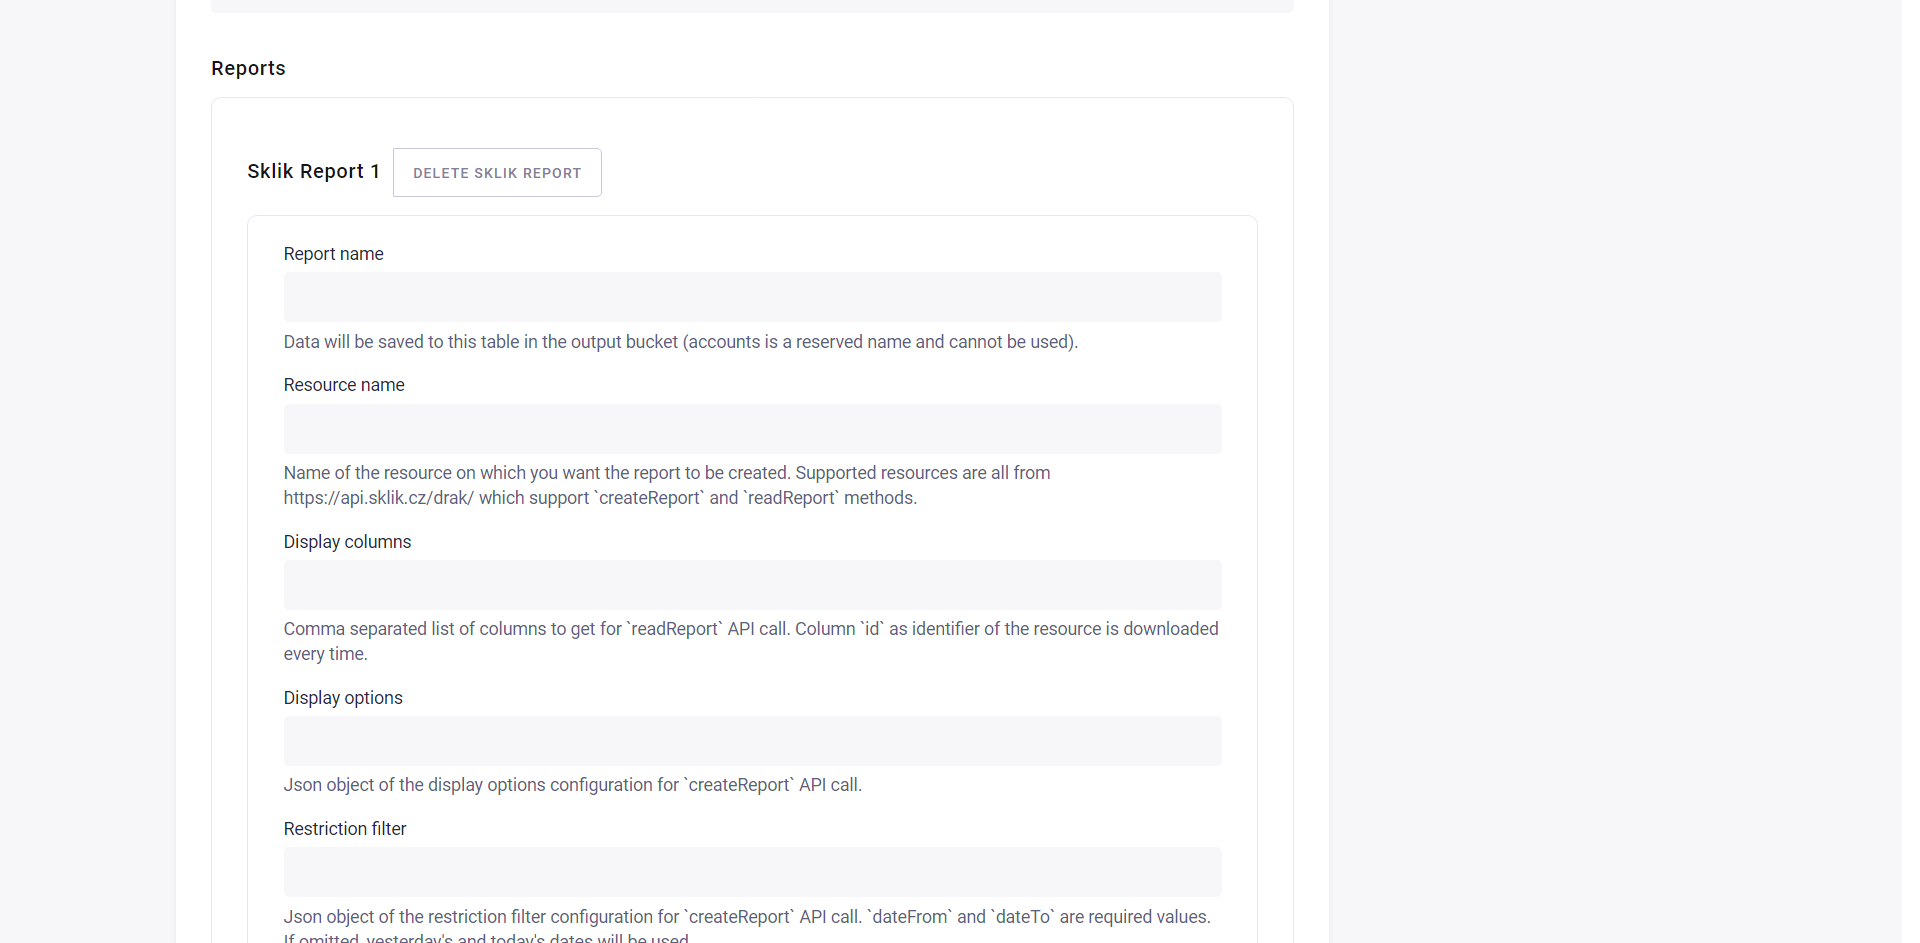
- name – your name for the report; it will be used for the name of the table in Storage. (Note that
accountsis a reserved name thus it cannot be used as a report name.) - resource – name of the resource on which you want the report to be created. Supported resources are all from api.sklik.cz/drak which support the
createReportandreadReportmethods (see Blog post for more information):adsbannerscampaignsgroupsintendsintends.negative- etc.
- restrictionFilter – Json object of the restriction filter configuration for the
createReportAPI call.dateFromanddateToare required values. If omitted, yesterday’s and today’s dates will be used.- The connector allows you to use relative days in these supported formats.
- displayOptions – Json object of the display options configuration for the
createReportAPI call - displayColumns – array of columns to get
- Column
idas the identifier of the resource is downloaded every time.
- Column
Warning: The main account used for access to the API is queried for campaigns and stats too. It is also saved to the table accounts but has the columns access, relationName,relationStatus and relationType empty. Prices are in halers so you need to divide by 100 to get prices in CZK.
API Limits
The current listing limit supported by the Sklik API is 100. A problem appears when statGranularity is added to displayOptions.
If you define daily granularity, the limit is divided by the number of days in the specified interval.
It means the interval between dateFrom and dateTo must not exceed 100 days.
Report Tables
Each report creates two tables: one with metadata and one with actual stats by date.
The metadata table named after the report has a primary key id (the column id is added to displayColumns automatically). Dots (.) in nested values will be replaced with underscores (_). The table is complemented with the column accountId with the id of the account.
The stats table is also named after the report with the suffix -stats and has a primary key comprised of id and date.
For instance, if you configure to download the columns name, clicks, impressions from the resource campaigns and call the report report1, you will get the table report1 with the columns id, name and the table report1-stats with the columns id, date, impressions, clicks.
Example
Let’s say we want to download daily stats for campaigns. The report will look like this:
- name:
report1 - resource:
campaigns - restrictionFilter:
{ "dateFrom": "2018-07-01", "dateTo": "2018-07-03" } - displayOptions:
{ "statGranularity": "daily" } - displayColumns:
id, name, clicks, impressions
The connector will create the table report1 which will look like:
| id | accountId | name |
|---|---|---|
| 15001 | 123 | Keboola.com - content |
| 15002 | 123 | Keboola.com - search |
And the table report1-stats:
| id | clicks | date | impressions |
|---|---|---|---|
| 15001 | 0 | 0 | |
| 15002 | 5 | 20180701 | 26 |
| 15002 | 0 | 20180702 | 10 |
| 15002 | 0 | 20180703 | 2 |